For any turbo trainer a relationship exists between the wheel speed and the resistance of the brake. For a standard turbo trainer this relationship is typically a somewhat arbitrary approximation to the resistance experienced when cycling outdoors. However, for a cycling simulator, the relationship should attempt to closely mimic the behaviour observed out on the road. Clearly the extent to which the actual behaviour is modelled determines the quality of the simulation.
In a standard turbo trainer there is no automated feedback between the speed of the wheel and the resistance of the brake. Ignoring any manual resistance controls, a fixed relationship exists between wheel speed and brake resistance, whilst the inertia of the cyclist and bike is often simulated with a flywheel. The key difference between this and an ergo trainer is that in an ergo trainer there exists a feedback loop between brake resistance and wheel speed. The feedback loop can be used to match the brake resistance to that expected under specific conditions. Essentially this is achieved by matching the total power expended by the brake with the estimated required power for cycling under the simulated conditions.
In Cyclismo we calculate power using the model derived by Martin et al. which has been validated against real world tests. This model takes into account the following:
- Speed
- Gradient
- Rider and bike mass
- Drag area
- Local wind speed and direction
- Yaw angle
- Bearing friction
- Rolling resistance
These quantities are then used to estimate the required cycling power, whilst inertia can be simulating by keeping track of the system energy and clamping the speed at a level suitable for the present reserve. We note that whilst some terms such as bearing friction are negligible, the model has been implemented in its entirety for completeness. In the future we will add corrections for the brake and flywheel inertia.
Mapping speed, power and brake resistance
To implement the power model described in the preceding section it is necessary to know how the power produced as function of wheel speed varies with the brake resistance. By obtaining a calibration map linking these three quantities one can adjust the brake resistance according to the current cycling conditions.
There are various ways of ensuring that cycling power and speed are consistent, however we consider it advantageous to calculate a 'virtual' cycling speed from the actual power produced by the rider. This way one can easily utilise power measurements from external devices such as hub or crank based sensors.
Once the virtual speed has been computed, an appropriate brake resistance can be calculated to force the wheel to the virtual speed This is achieved using the calibration map, and effectively forces the actual wheel speed to be equivalent to the predicted wheel speed for the current cycling conditions.
Calibrating the Tacx Bushido
We performed a trial calibration by recording power output as a function of actual wheels speed at fixed brake resistances. The results are shown in the figure below.
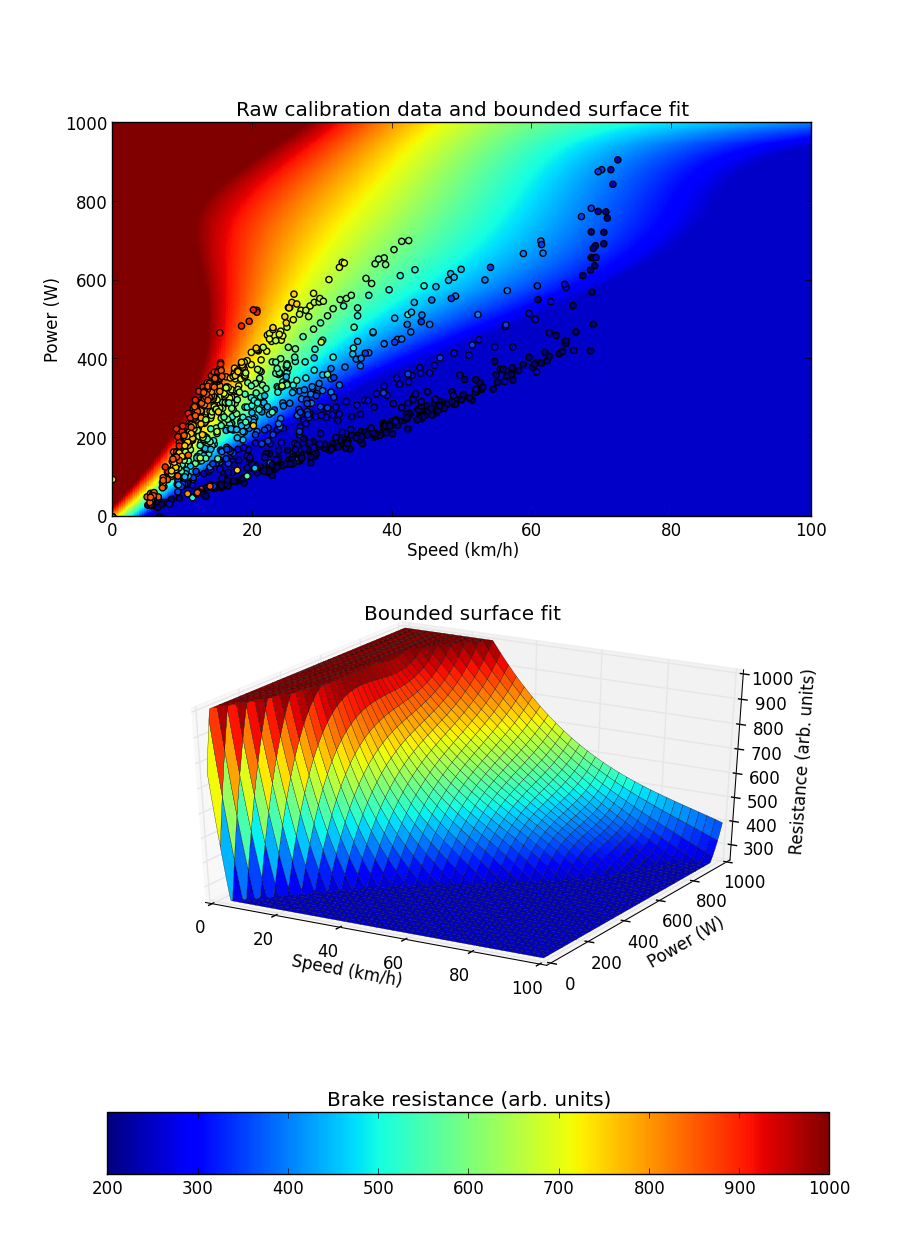
In the top figure we plot the raw calibration data which has been measured for fixed brake resistance intervals of 50, ranging from -300 to 1000. We note that the Bushido has a dead zone below a resistance of about 250 where any further reductions in resistance have little or no effect. Resistances above 1000 were not tested as the wheel starts slipping on the brake even when pedalling smoothly with a low gear and high wheel-brake compression. Above resistances of ~250 we observe steady increases in the amount of power produced for a fixed wheel speed, and that power is approximately a linear function of wheel speed below about ~70km/h.
Taking these observations into consideration we fit a surface to the calibration data by first fitting linear regression lines to each fixed resistance series and extrapolating within reasonable bounds. This helps to ensure a reasonable surface fit at powers in excess of what we were able to produce during calibration.
The surface fit is shown in the background of the top figure where it is compared to the observations, and in 3D in the bottom figure. In both cases it has been bounded such that the brake resistance is kept between 250 and 1000 which in our opinion are reasonable limits.
We have implemented the speed, power, resistance map described by the bounded surface fit in Cyclismo alongside two other methods; one which utilises a PID controller, and another which is based on the OEM brake speed map. We hope that the former two models will help to create a more realistic cycling experience and have the additional advantage that the Bushido head unit is no longer required!
The fitting tool used to generate these plots and the raw calibration data is available here.