Neural Networks and Deep Learning
A little while ago i started reading the free online book "Neural Networks and Deep Learning" by Michael Nielsen. If you're looking for an introduction to the subject then this is a really great place to start.
In the first two chapters Michael explains how to use stochastic gradient descent to train a feed forward neural network to recognise handwritten digits. The highlight for me is the solid explanation of the theoretical side, and the in situ application of this to a real world problem. The result is 74 lines of Python code capable of recognising handwritten digits with an error rate of less than 4%.
As an exercise I decided to re-implement Michael's Python example in C99, using the GNU Scientific Library (GSL) for matrix / vector operations and Catch for some (limited) unit tests.
To allow direct comparison with the Python example i've set it up to read in the first 50,000 numbers from the MNIST database of handwritten digits, and use the final 10,000 to test the network on each epoch, just like in the example.
As you'd expect the C port behaves just like the Python example, with some minor variation likely due to differences in the generation of random numbers and floating point inaccuracies. Perhaps the one nice thing is that despite neither version being optimised for speed, the C implementation runs about 15 times faster on my machine, making it less time consuming to play with the various parameters.
Finally a big thank you to Michael for taking the time to write this book, and for making it freely available.
The code for the C port can be found here.
Simulating the SSD1306 OLED display in simavr
As part of a larger project I've started building some virtual parts for simavr. It's turned out to be a real pleasure to use and i'd highly recommend it. Great job BusError!
Here you see an identical firmware running on both the physical device and in simavr. Aside from the fact that simavr runs about 10 times faster than the actual hardware the results are identical. The demo goes through the routine of testing the driver functionality. This includes things like setting the contrast, inverting the display, writing to the buffer and changing the orientation.
Currently the virtual part has only been tested with this driver. If you're using some of the more obscure hardware functionality you may need to extend it. The same goes if you're using the parallel or I2C interfaces.
Mapping speed, resistance and power on an ergotrainer and calibrating the Tacx Bushido
For any turbo trainer a relationship exists between the wheel speed and the resistance of the brake. For a standard turbo trainer this relationship is typically a somewhat arbitrary approximation to the resistance experienced when cycling outdoors. However, for a cycling simulator, the relationship should attempt to closely mimic the behaviour observed out on the road. Clearly the extent to which the actual behaviour is modelled determines the quality of the simulation.
In a standard turbo trainer there is no automated feedback between the speed of the wheel and the resistance of the brake. Ignoring any manual resistance controls, a fixed relationship exists between wheel speed and brake resistance, whilst the inertia of the cyclist and bike is often simulated with a flywheel. The key difference between this and an ergo trainer is that in an ergo trainer there exists a feedback loop between brake resistance and wheel speed. The feedback loop can be used to match the brake resistance to that expected under specific conditions. Essentially this is achieved by matching the total power expended by the brake with the estimated required power for cycling under the simulated conditions.
In Cyclismo we calculate power using the model derived by Martin et al. which has been validated against real world tests. This model takes into account the following:
- Speed
- Gradient
- Rider and bike mass
- Drag area
- Local wind speed and direction
- Yaw angle
- Bearing friction
- Rolling resistance
These quantities are then used to estimate the required cycling power, whilst inertia can be simulating by keeping track of the system energy and clamping the speed at a level suitable for the present reserve. We note that whilst some terms such as bearing friction are negligible, the model has been implemented in its entirety for completeness. In the future we will add corrections for the brake and flywheel inertia.
Mapping speed, power and brake resistance
To implement the power model described in the preceding section it is necessary to know how the power produced as function of wheel speed varies with the brake resistance. By obtaining a calibration map linking these three quantities one can adjust the brake resistance according to the current cycling conditions.
There are various ways of ensuring that cycling power and speed are consistent, however we consider it advantageous to calculate a 'virtual' cycling speed from the actual power produced by the rider. This way one can easily utilise power measurements from external devices such as hub or crank based sensors.
Once the virtual speed has been computed, an appropriate brake resistance can be calculated to force the wheel to the virtual speed This is achieved using the calibration map, and effectively forces the actual wheel speed to be equivalent to the predicted wheel speed for the current cycling conditions.
Calibrating the Tacx Bushido
We performed a trial calibration by recording power output as a function of actual wheels speed at fixed brake resistances. The results are shown in the figure below.
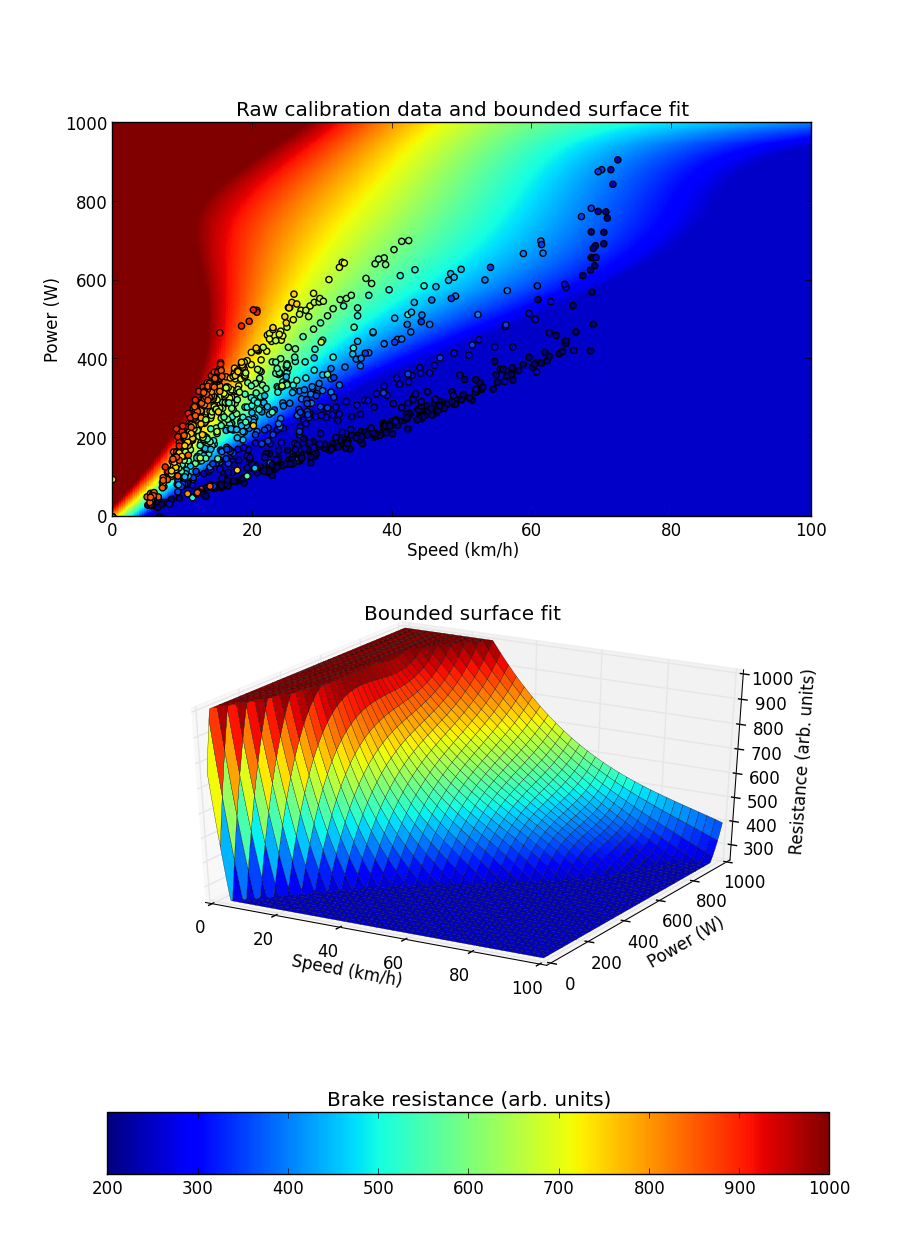
In the top figure we plot the raw calibration data which has been measured for fixed brake resistance intervals of 50, ranging from -300 to 1000. We note that the Bushido has a dead zone below a resistance of about 250 where any further reductions in resistance have little or no effect. Resistances above 1000 were not tested as the wheel starts slipping on the brake even when pedalling smoothly with a low gear and high wheel-brake compression. Above resistances of ~250 we observe steady increases in the amount of power produced for a fixed wheel speed, and that power is approximately a linear function of wheel speed below about ~70km/h.
Taking these observations into consideration we fit a surface to the calibration data by first fitting linear regression lines to each fixed resistance series and extrapolating within reasonable bounds. This helps to ensure a reasonable surface fit at powers in excess of what we were able to produce during calibration.
The surface fit is shown in the background of the top figure where it is compared to the observations, and in 3D in the bottom figure. In both cases it has been bounded such that the brake resistance is kept between 250 and 1000 which in our opinion are reasonable limits.
We have implemented the speed, power, resistance map described by the bounded surface fit in Cyclismo alongside two other methods; one which utilises a PID controller, and another which is based on the OEM brake speed map. We hope that the former two models will help to create a more realistic cycling experience and have the additional advantage that the Bushido head unit is no longer required!
The fitting tool used to generate these plots and the raw calibration data is available here.
Cyclismo change log
Known bugs:
- Don't handle other programs seizing control of ant radio gracefully
- Don't handle ant usb stick removal gracefully
- Let us know...
Change log:
- 0.0.1 initial release
- 0.0.2 add wakelock to stop ant sleeping
- 0.0.3 Updated minimum recording distance to 0m (sensor values now drop to zero), improved location determinism, handling most exceptions in TurboService (needs improvement)
- 0.0.4 Updated google play services lib (not sure how different it was)
- 0.0.5 Pause status only check first 3 bytes (thanks Dan), added ability to log ant+ communication: see settings -> ant+ -> diagnostic logging
Download
Bushido news
The Big D and I have been working hard at coding an android app with Tacx Bushido support. The current state is that we have a working app (albeit with a few rough edges) that can simulate GPX courses. So it is with great pleasure that we release a preview (source code now up):
It is worth pointing out that you can run this in VirtualBox on windows/max/linux using android x86 (android-x86.org). I use android-x86-4.0-RC2-eeepc.iso for testing.
You will need to enable:
Feature requests welcome.
` <http://cowboycoders.org/cyclismo-change-log/>`__
In other news, BerryS has reversed a few more nuggets of the Bushido Headunit protocol (see the wiki). We now know about long/medium button presses, the device serial and the user's weight. Cheers BerryS!
NO WARRANTY - PLEASE REGARD AS EXPERIMENTAL
Introducing JFormica an ANT+ library for java
I have rewritten python-ant by Martín Raúl Villalb in Java. There are presently two drivers: one is a wrapper around Dynastreams own ant library for Android and the other is a javax.usb driver for ANT+ usb sticks. This allows code to be be prototyped on a development machine before adding the android specific stuff.
Features:
- Most ANT messages have been mapped to a class, and if configurable, contain methods to adjust those configuration options.
- Easily add listeners to individual channels with message-type filtering
- Utility methods to wait for a response (with timeouts) to any message sent to the ant chip
- Burst message helper function (send bursts by simply passing a byte []) - will throw an exception if transmission fails
Grab it from : https://github.com/cowboy-coders/JFormica
Here is a code sample:
class Listener implements  BroadcastListener{

@Override
public void receiveMessage(BroadcastDataMessage message) {
System.out.println("Heart rate: " + message.getData()[7]);
}

}

public void test_hrm() throws InterruptedException, TimeoutException {

// first usb ant-stick
AntTransceiver antchip = new AntTransceiver(0);

Node n = new Node(antchip);

NetworkKey key = new NetworkKey(0xB9,0xA5,0x21,0xFB,0xBD,0x72,0xC3,0x45);
key.setName("N:ANT+");

n.start();
n.reset();

// sets network key of network zero
n.setNetworkKey(0, key);

Channel c;
c = n.getFreeChannel();

c.setName("C:HRM");

ChannelType channelType = new SlaveChannelType();

c.assign("N:ANT+", channelType);

c.registerRxListener(new Listener(), BroadcastDataMessage.class);

c.setId(0, 120, 0, false);

c.setFrequency(57);

c.setPeriod(8070);

c.setSearchTimeout(255);

c.open();

Thread.sleep(10000);

c.close();
c.unassign();

//return the channel to the pool of available channels
n.freeChannel(c);

n.stop();

}
PyBushido code up
Overview of PyBushido:
bushido_logger.py
replicates Tacx TTS slope distance mode (headunit enters PC Communication mode)
functionality:
- logs data to console
- slope buttons (up and down arrows) implemented
bushido_middle.py
a simple man in the middle implementation for snooping on communication from the headunit to the brake.
to use:
- start training on tacx headunit
- run bushido_middle.py
- you can optionally edit injections.py to modify data before retransmission
Source code
You can grab all the source code we are using to reverse engineer the Tacx Bushido here:
Reverse engineering the Tacx Bushido
The Bushido is a top of the range turbo trainer from Tacx. It consists of a brake unit based around an alternator which is linked to a head unit mounted on the handlebars using the ANT protocol. The head unit can be used alone, or linked to a PC using the ANT wireless protocol. From the PC the user can design training programs and log data such as the rider power output, heart rate, cadence etc.
Unfortunately the PC software is expensive, runs only on Windows and crashes frequently. This led Will and I to reverse engineer the protocol allowing full control over the turbo trainer without using the Tacx software. More details will follow shortly, but for now we have documented the protocol here.
Update 24/10/12: We have almost completely documented the brake to the computer protocol (see link to the wiki above) using a "man in the middle" approach developed by Will. It appears that the brake sends back much more data to the head unit than is actually made available to the user. A graph showing the data sent back from the brake is shown below. Whilst we've identified which values correspond to those displayed on the head unit, we're still trying to figure out what some of the other quantities are. We've uploaded an example log of brake only communication here, and the data from the graph below here, if you are interested in helping.
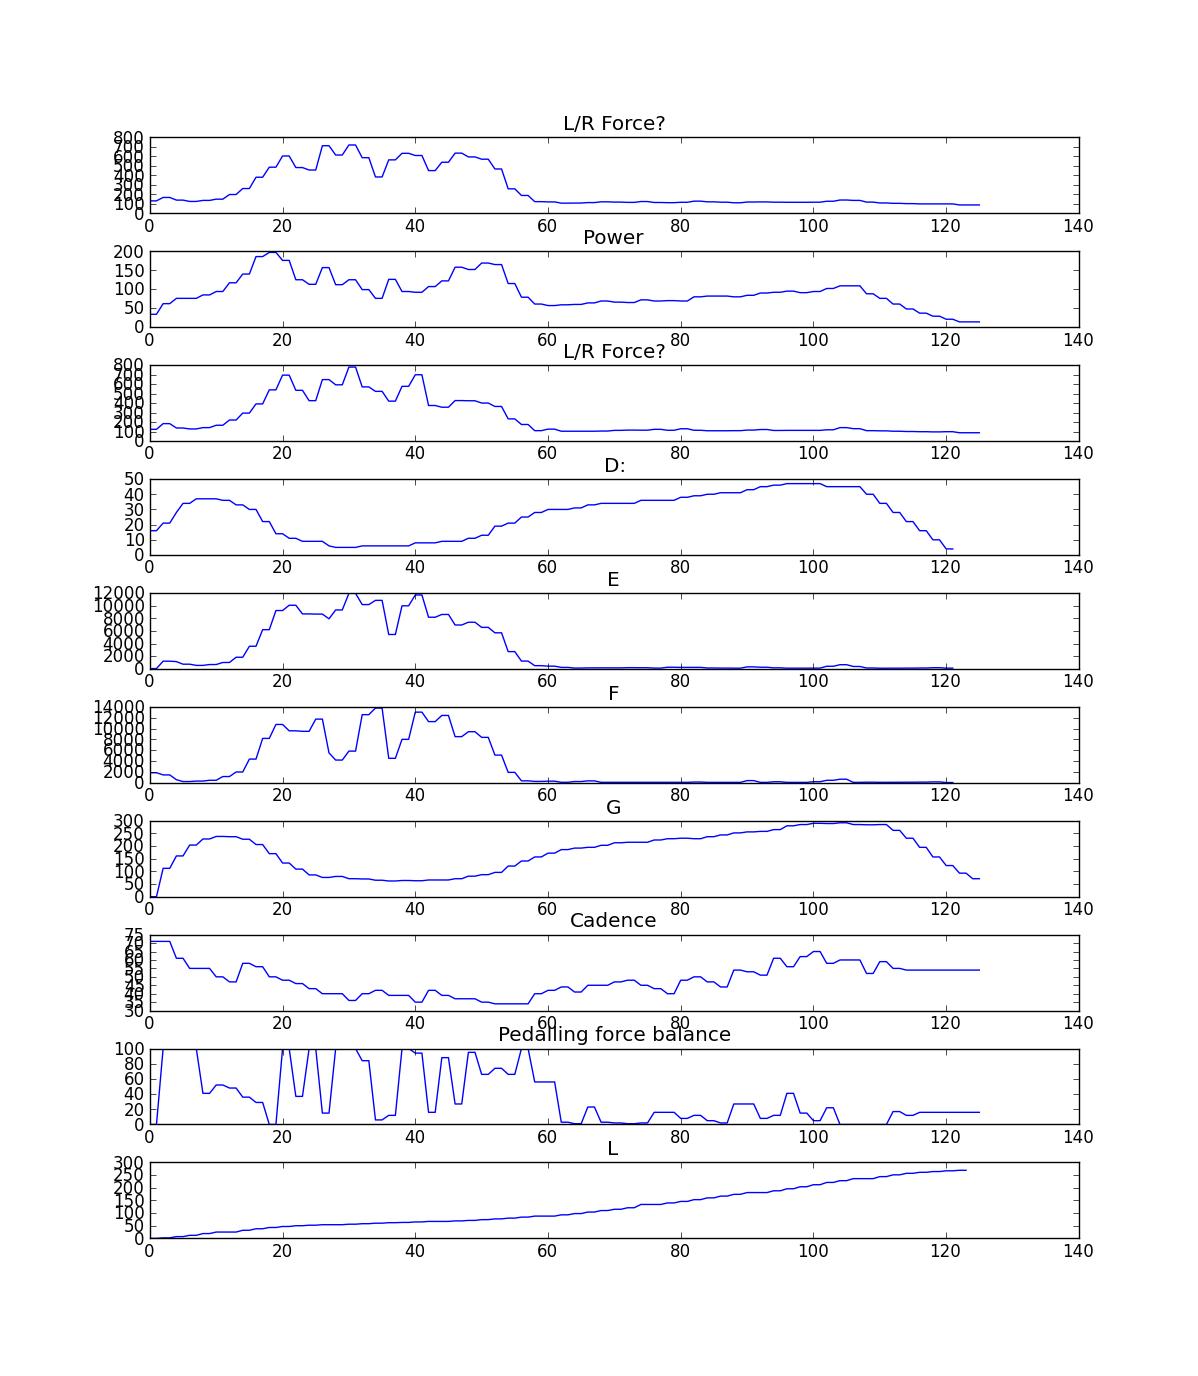
Key:
A: Related to power somehow?
B: Power (confirmed)
C: Very similar to A, left/right version of?
D:Roller speed (rps) of brake? Note: Assuming roller radius of 30mm, at a speed of 30kmph the roller rotates at 45rps, which is in good agreement with this assumption.
E: Unknown
F: Unknown
G: Actual wheel speed (confirmed) - note wheel speed displayed on head unit is computed from power. Actual wheel speed is used to calculate distance.
H: Cadence (confirmed)
I: Pedalling balance (confirmed) - affects bar at bottom of head unit
L: Some sort of counter: Doesn't affect distance on head unit. Resets when pedalling is stopped.
M: Brake temperature?
Accelerometer controlled RGB Lamp
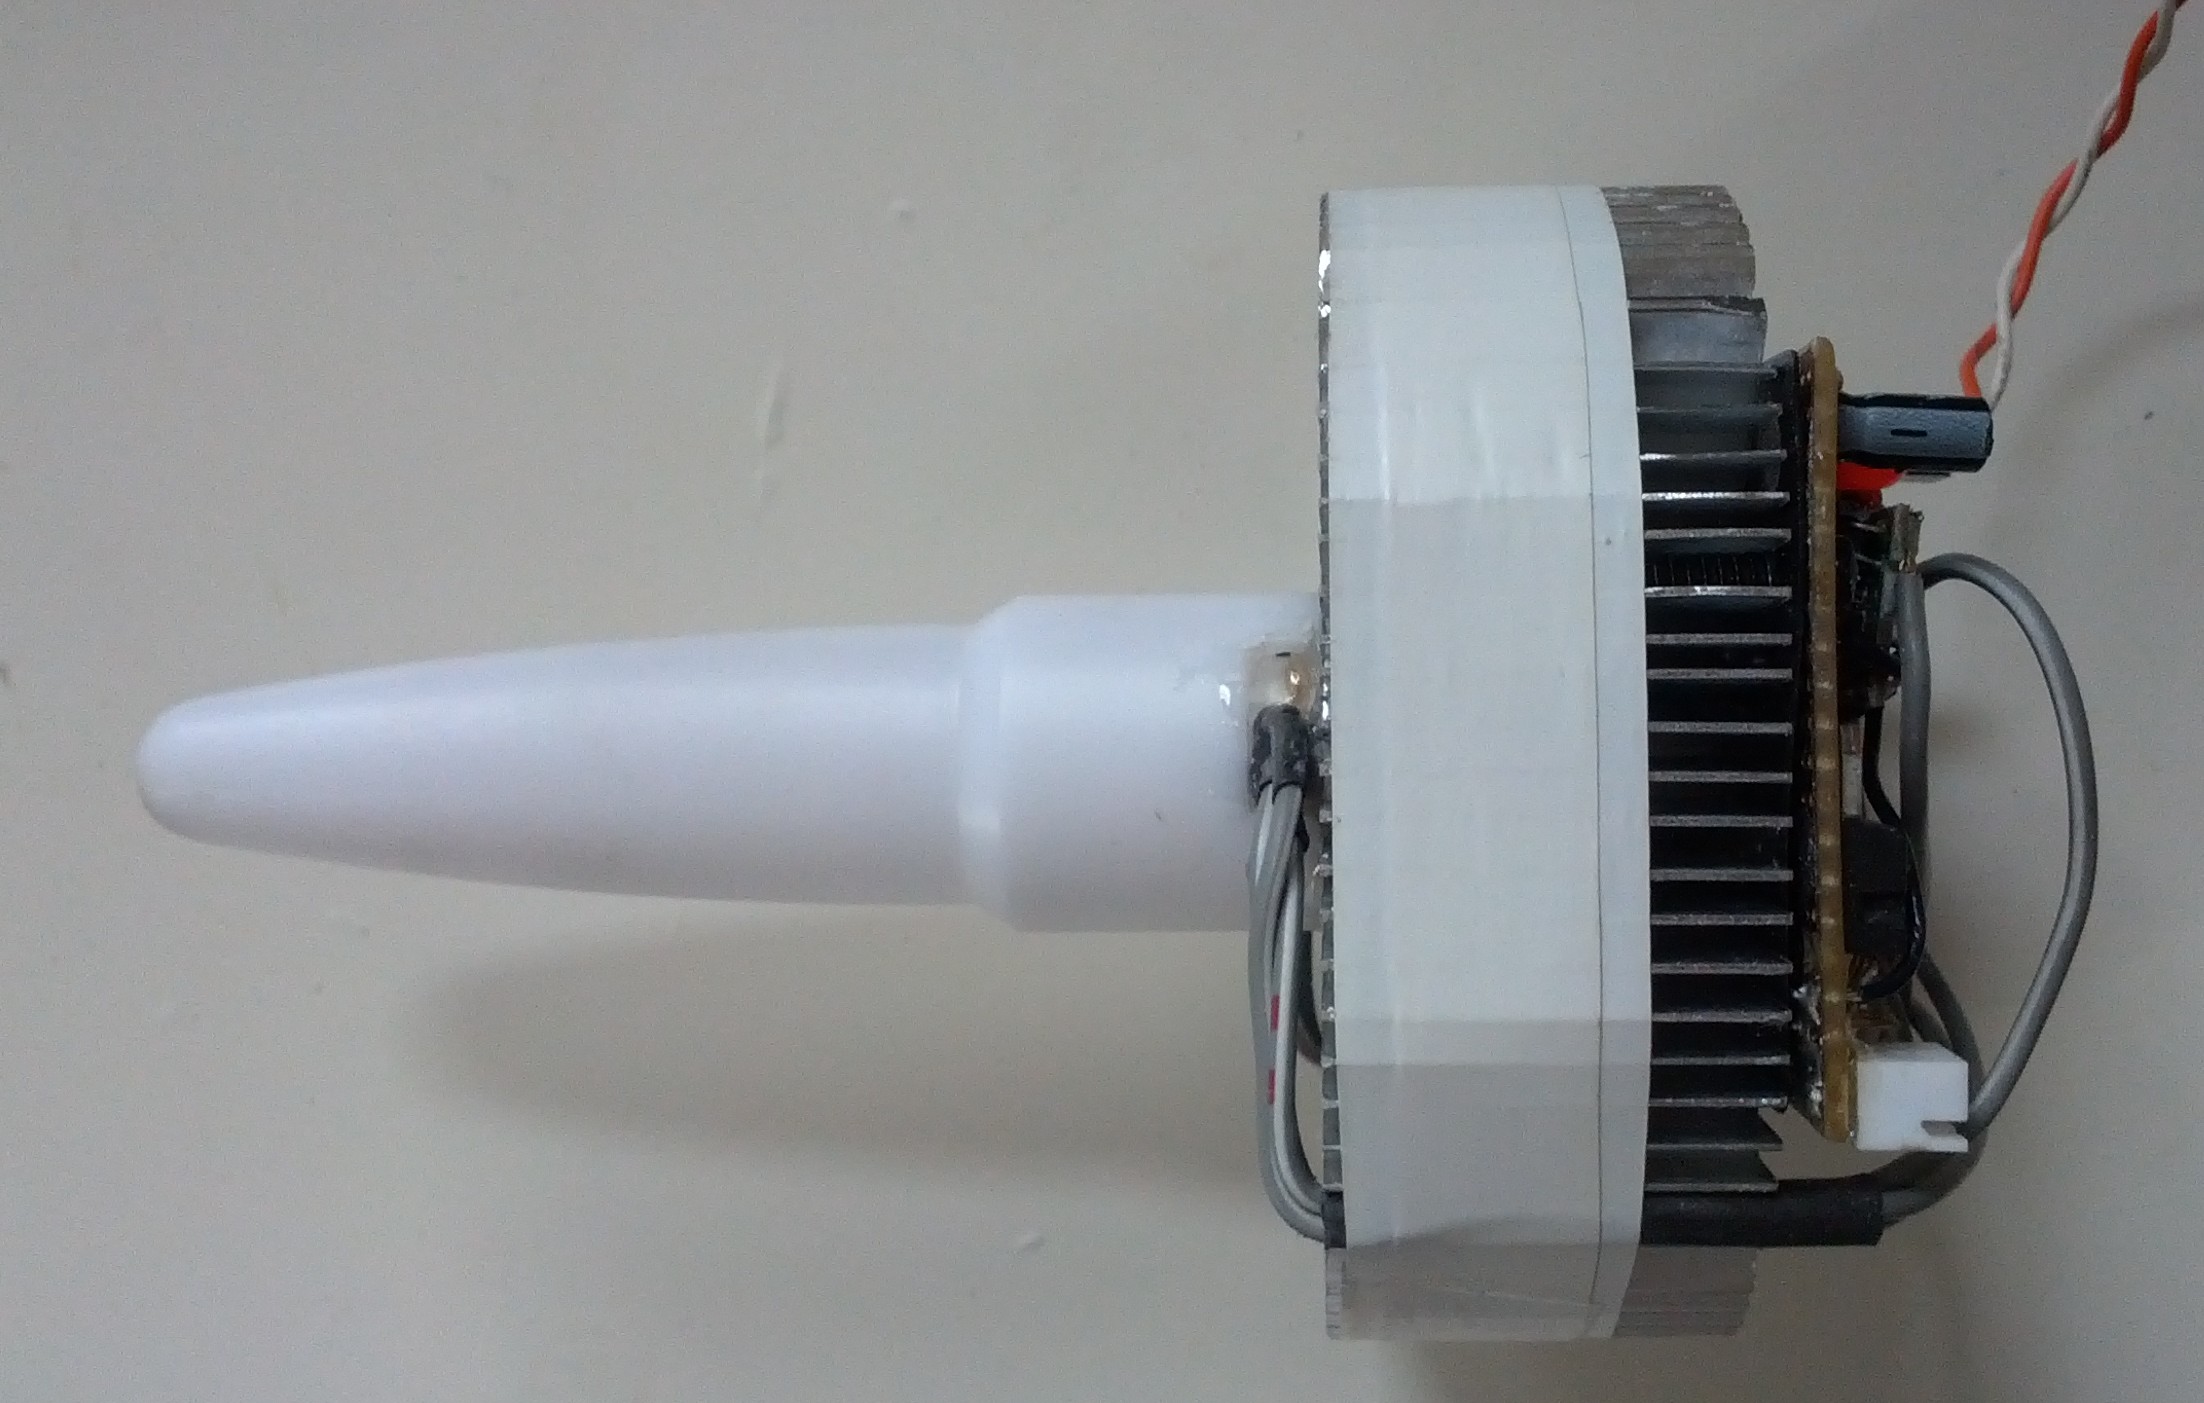
This is an RGB Lamp assembly that I constructed based around the following parts:
- Atmel ATmega8 MCU
- ADXL345 triple axis accelerometer
- 10W RGB LED
- ~350mA LED driver x 3
- Beam diffuser
- 10W LED heatsink
The idea is that the accelerometer is used to calculate the lamp position in spherical polar coordinates, which are then used to control the colour of the lamp. The LED is driven by 3 switching converters coupled to the PWM outputs of the ATmega8 through opto-isolators.
Anyway, enough details, here's a video of the lamp in action:
And for those interested in the circuitry (picture taken prior to adding optos):
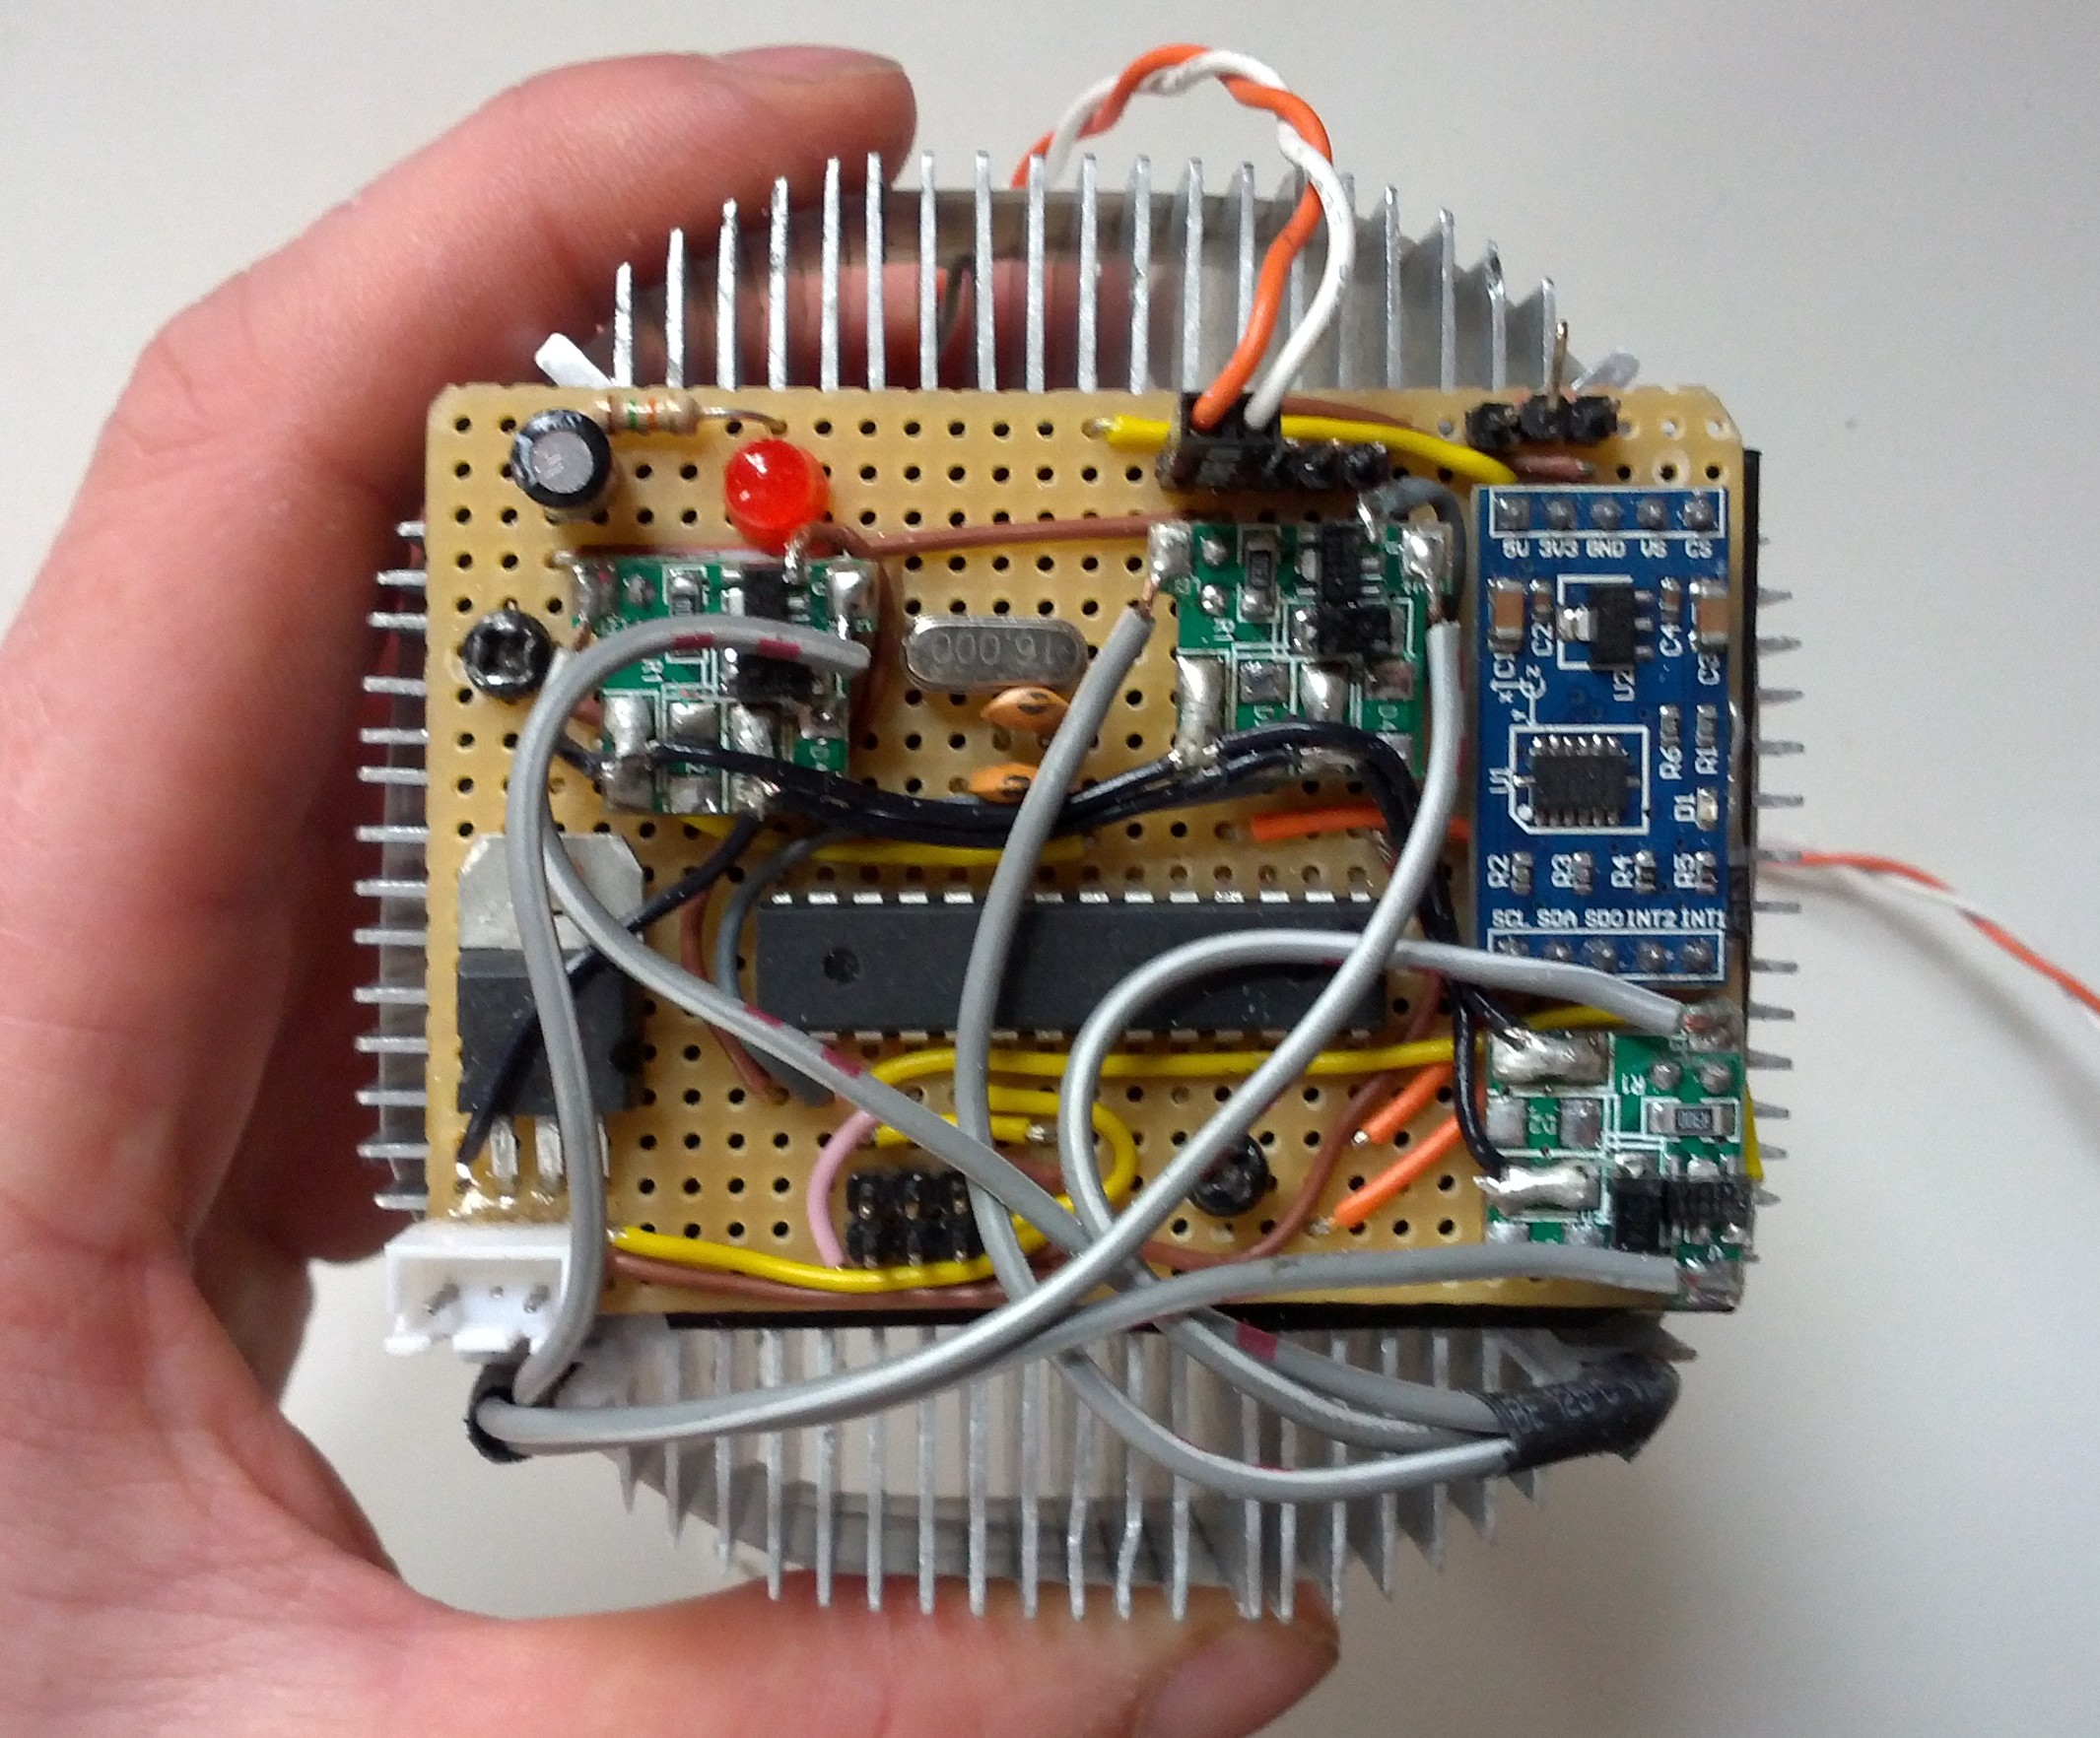
The blue board on right is the ADXL345 break out board, which also features a selectable 3.3V regulator and TWI pull up resistors. In this case the regulator is used because the ATmega8 I had lying around requires a minimum of 4.5V. Fortunately the SDA and SCL lines of the TWI bus are open drain so there's no need to worry about level conversion in this case. I was actually surprised at just how good the ADXL345 is. Not only does it have some cool stuff like tap detection, with a little bit of software filtering I can comfortably get an angular resolution of ~0.25 degrees after the conversion to spherical polars.
Also seen on the above picture are three little green boards which are the LED drivers, hooked up directly to the DC input in the bottom left hand corner which is 16V. Originally I built my own switching converter, but it actually worked out cheaper (and faster!) to modify modules from DX by removing the rectifier and soldering a wire directly to PT4115 dimming pin for brightness control. Obviously, it's a good idea to use an opto-isolater between the dimming pin and the MCU, not only in case the PT4115 fails, but because the dim pin registers ~5.3V and is about 1mm from the 16V supply!
Other things that you see are an ISP header in the lower middle, 16MHz crystal in the centre, an LED in the top left, and switch connection / UART headers in the top right. The UART header was used for debugging with a CP2102 USB to UART bridge. These are awesome little modules which are well worth investing in, especially if you don't have a debugger.
The code for the project is now available here:
Comparison of Tacx Bushido vs Powertap SL+
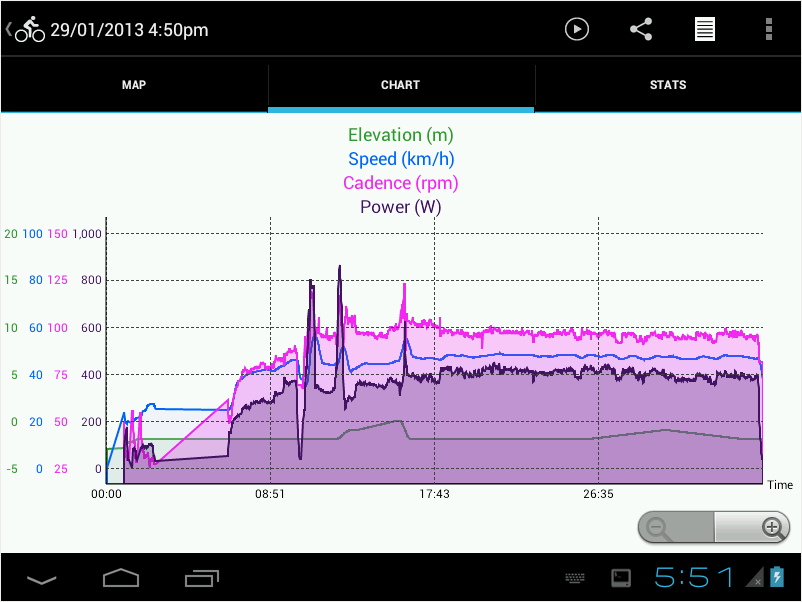
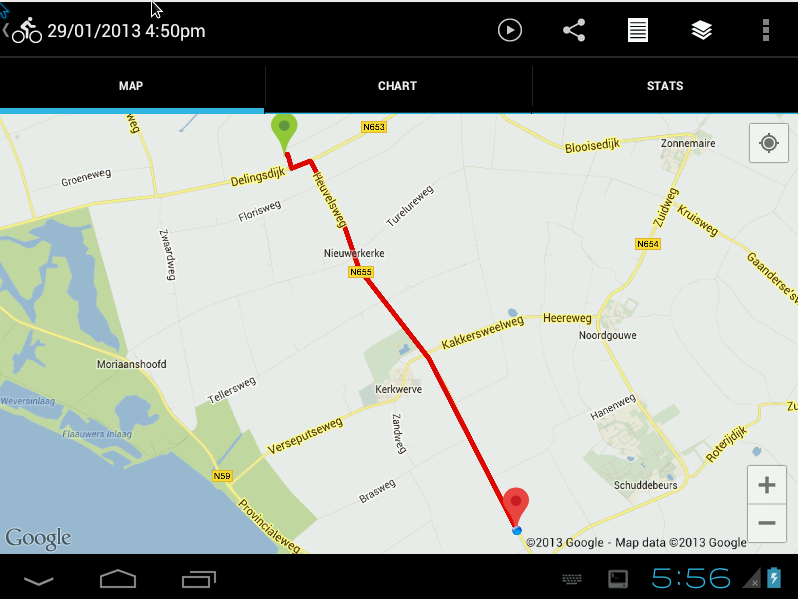
Here's one for cyclists: A quick comparison of the power measurement from a Tacx Bushido and a PowerTap SL+ hub. The data was acquired over a 10 mile time trial simulated by Tacx Trainer software 2. Data from the PowerTap was recorded with a Garmin 705.
The procedure:
- Calibrated Bushido with the coast down test. Obtained 10.9
- 5 minute warm up at ~250 Watts
- Calibrated Bushido again. Obtained 10.2
- Calibrated PowerTap via the Garmin 705
- Road the 10 mile TT (took 20 minutes 49 seconds)
I then wrote a quick Python script to plot the data exported from Tacx Trainer and tcx file from the Garmin. Here are the results:
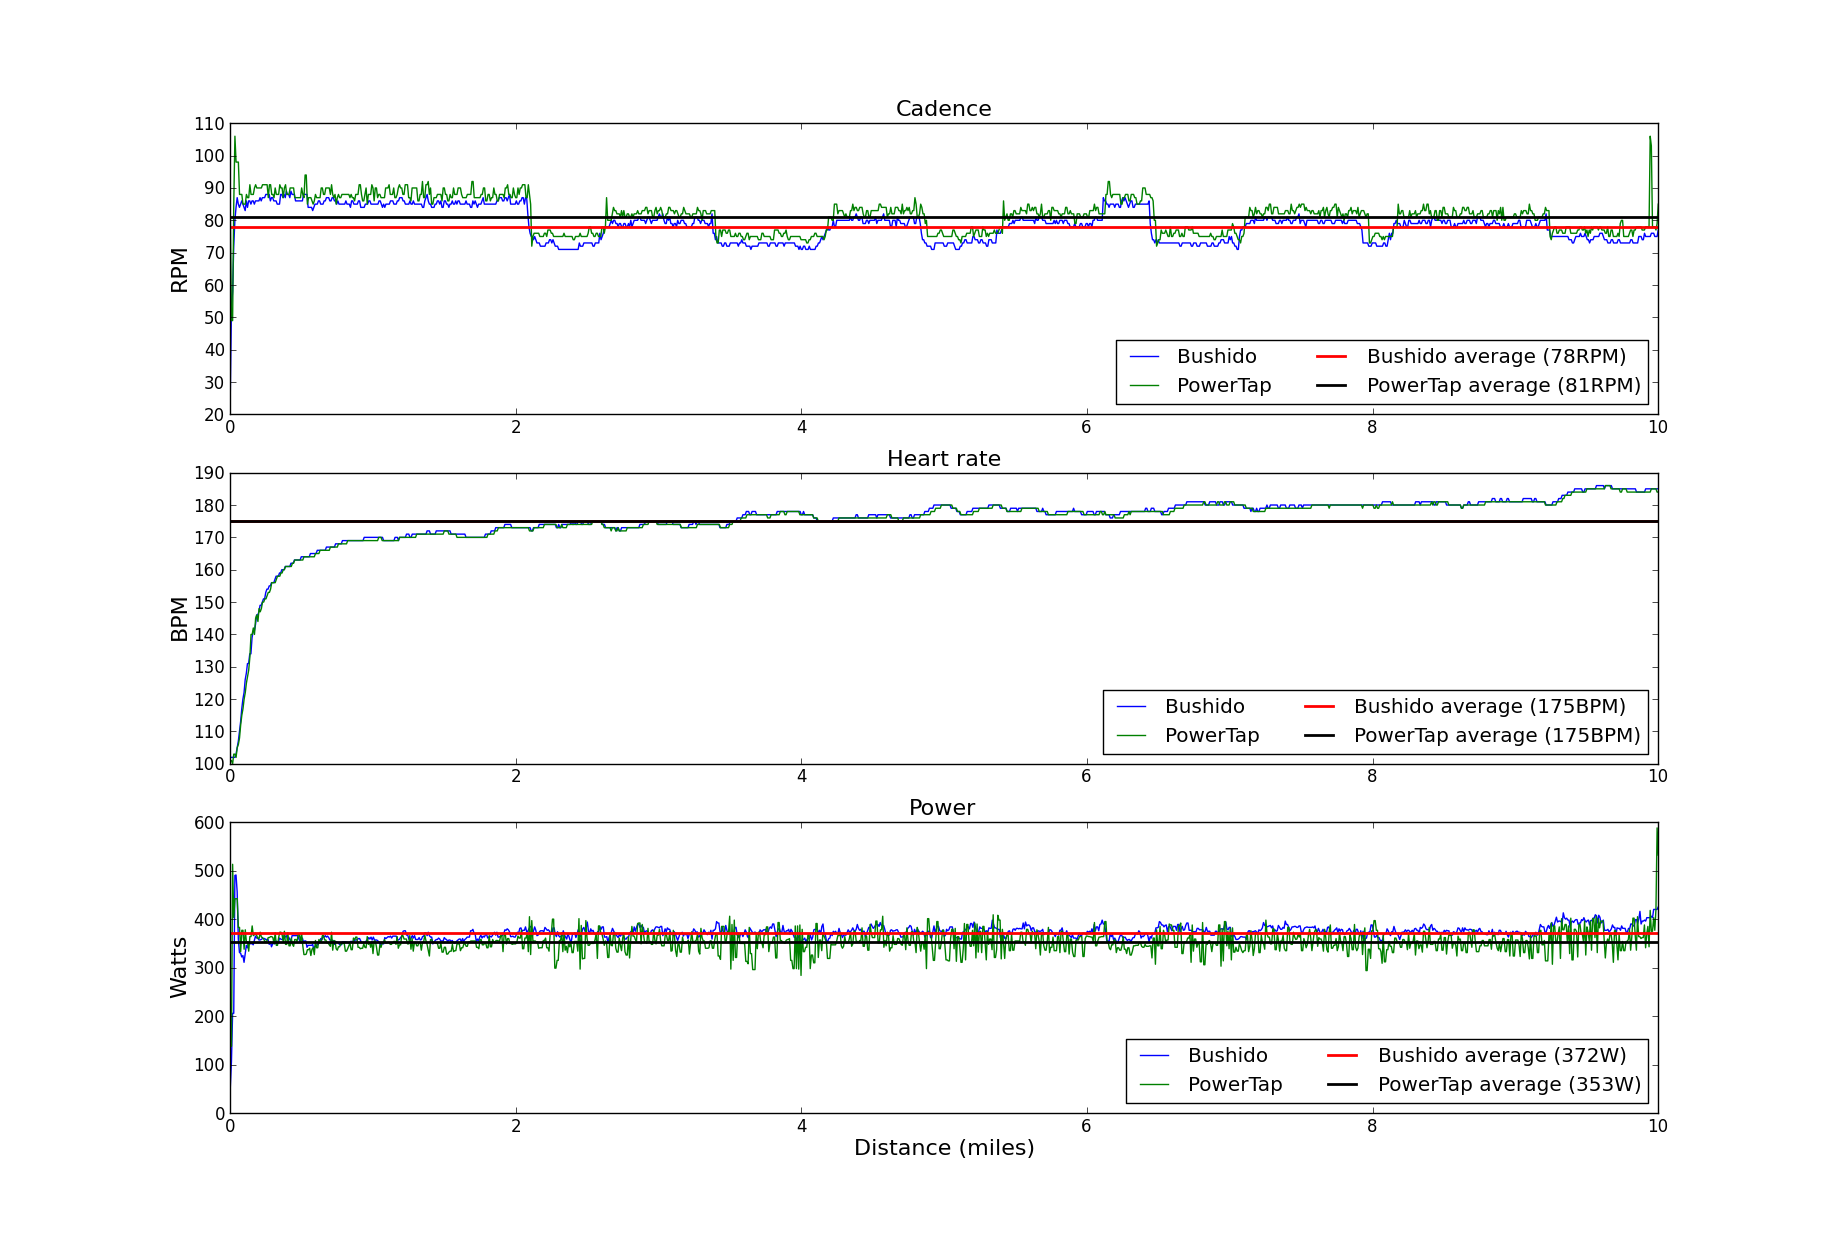
Some observations:
- Cadence which is estimated from variations in torque by both devices is only an approximation to the real cadence.
- Heart rate which in both cases is measured by a Garmin Ant+ monitor is (almost!) the same as would be expected.
- Average power output from the Bushido is recorded ~6% higher at 372W than the PowerTap which averages 352W.
- The power output from the Bushido drifts upwards with time, whilst the output from the PowerTap does not. However the output from the PowerTap was used for pacing so it is impossible to determine which one is drifting.
- The power output from the Bushido is less noisy than that from the PowerTap.
- Tacx Trainer 2 is easily the worst piece of software i have ever used.
- The Bushido on the other hand is well engineered, that is apart from the screen on the head unit which is terrible.
In conclusion I was very pleased to see a good agreement between both devices. If the correction factor on the Bushido was adjusted, it could be made to agree closely with the PowerTap. However, most importantly the Bushido measures consistently and is therefore a very useful training device on its own.
I'll upload the script i wrote when i get a chance.
Page 1 / 3